Embracing Change with Data
Posted on February 20 at 2:03pm
When you work in this industry, you learn pretty quickly that things are constantly changing, which means Oil & Gas companies are constantly adapting. As most folks in Canada know all too well, price shocks have been a recurring feature of the global energy landscape since the 1970s. That’s easy to forget when we go through a period of relative stability, as we did from 2010 to 2014. But stability is not the norm - quite the opposite.
In recent years, we’ve been dealing with an extraordinary amount of simultaneous change.
For starters, the dramatic oil price decline that began in late 2014 has been followed by a slow and uneven recovery, as the market gradually rebalances. The external environment has forced companies to make significant adjustments on capital expenditures, operating costs and headcount. We’ve all had to make our businesses competitive at a much lower price level.
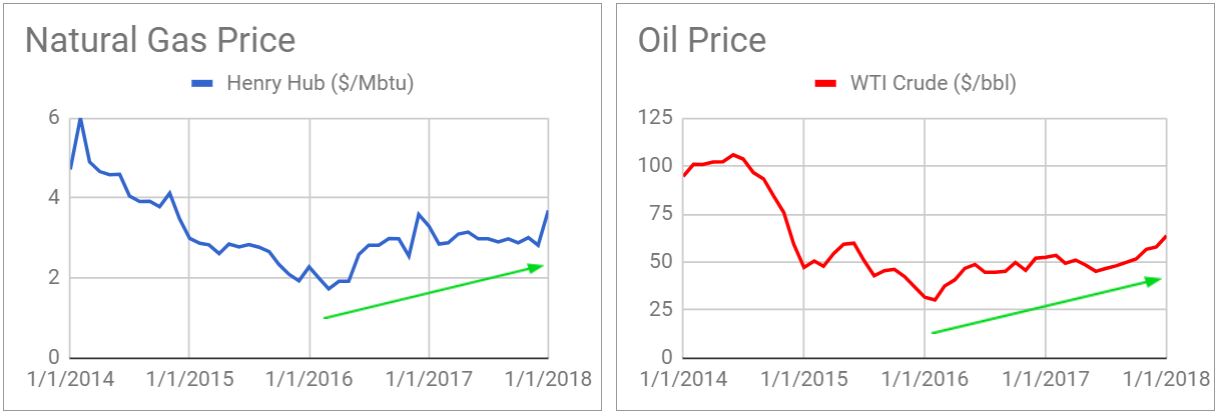
The industry has steadily recovered, with WTI above $60 in 2018, as compared with $35 in February 2016 (exactly two years ago), when WTI was at its lowest. Despite this gain, the benefits have been uneven. While US Shale has boomed, OPEC continues to lose market share and Canada’s most important export customer is becoming self-reliant.
So what is Canada to do?
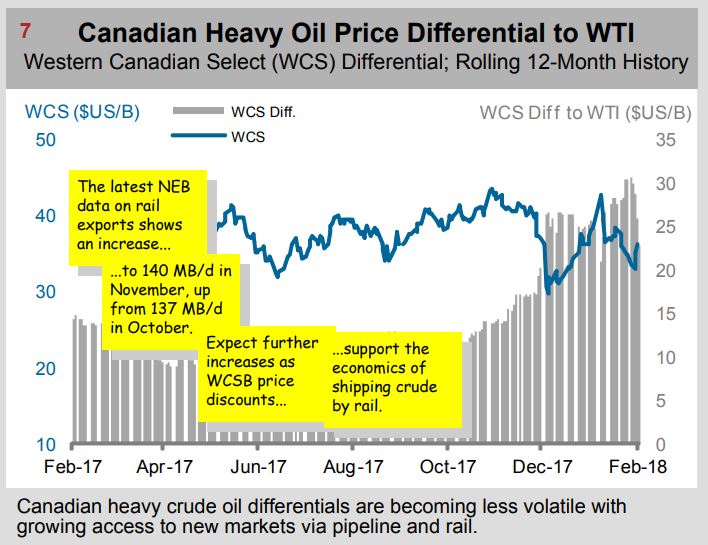
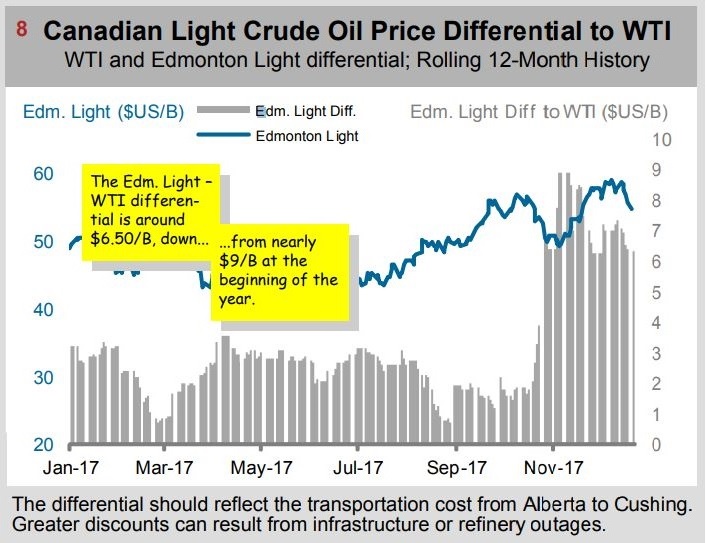
Canada certainly benefits from a higher oil price, but according to ARC Energy Institute, one of our biggest hurdles right now is our price differential between the WTI standard and the Canadian standards, Western Canadian Select and Edmonton Light.
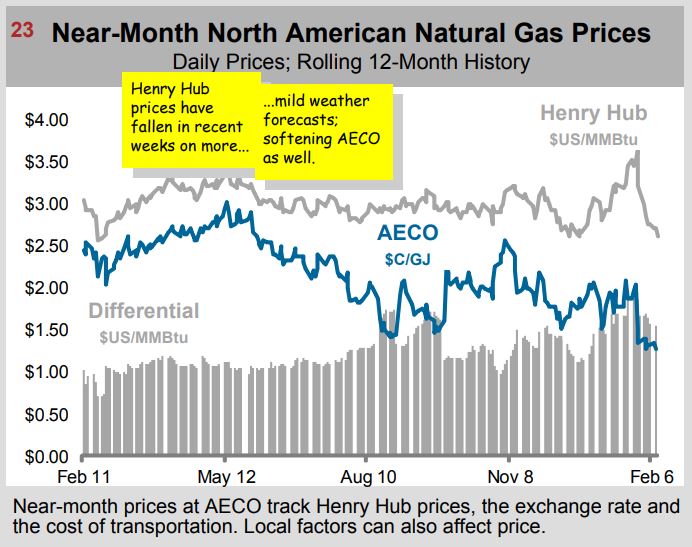
But it’s not just oil either. Canada is selling its natural gas at a significant discount to the US, with AECO nearly half the price of Henry Hub.
Why we’re selling our oil and gas at discount is a question for macroeconomics and geopolitics, but it suffices to say that it is due to both exogenous and endogenous factors - as in, some if it is out of our control, but some of it is within.
Taking Control
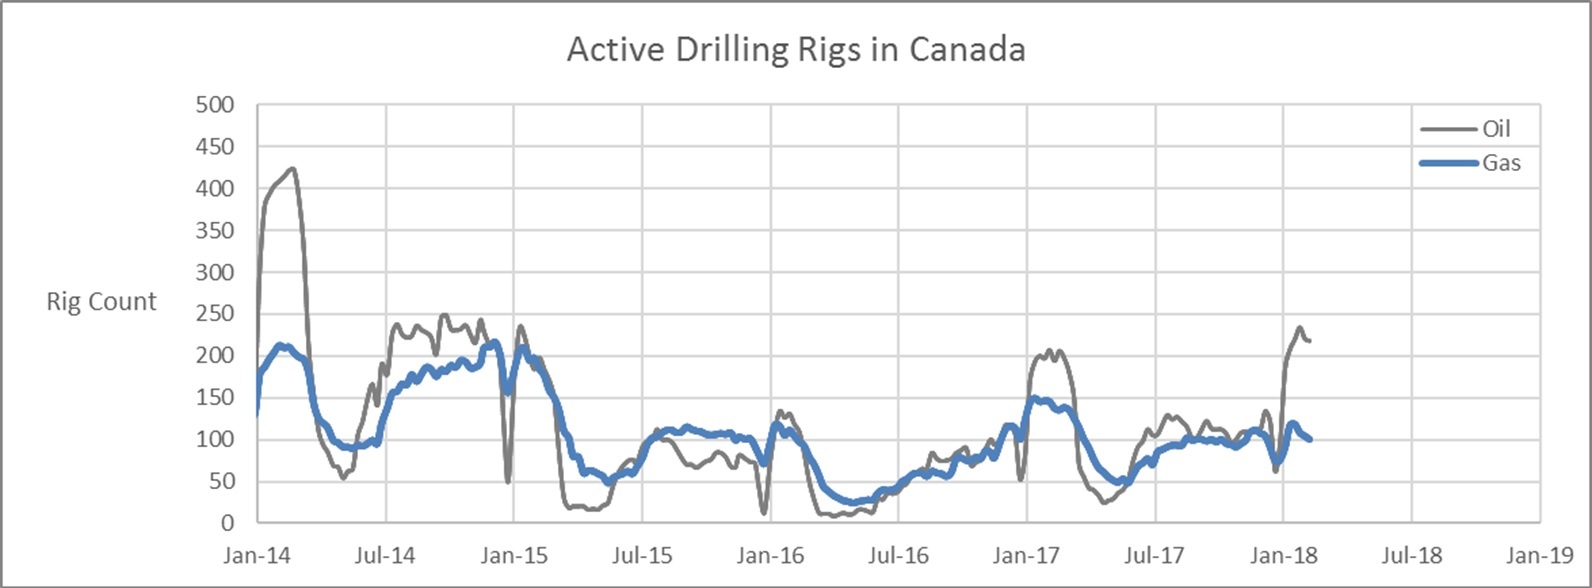
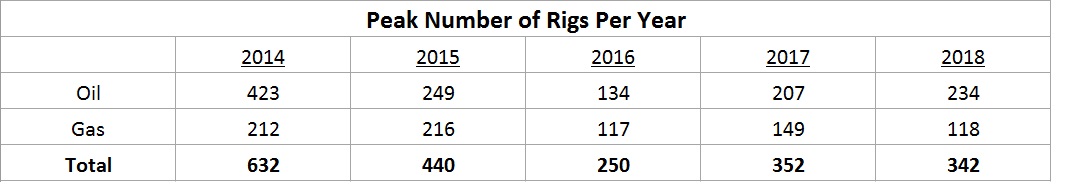
Canada needs to embrace everything within its control to spring back into this recovery, and build towards a future of sustainability. Take a look at our weekly rig counts since January 2014, before the last crash. We entered 2014 with over 600 active rigs, and after 4 years of rebalancing, we’re sitting at a peak of roughly 340 in 2018. And that’s focusing on winter drill alone, when snow permits access to remote areas and promotes the highest drilling activity of the year.
How do we return to the 2014 highs? Fortunately, we’re on our way there, because rig count doesn’t tell the whole story. We’ve decided to dive deeper into the data, and apply some data science to understand what’s really going on. Then, we can truly come up with what Canada must do to thrive.
Active rig count is widely viewed as a barometer for the health of the Oil & Gas sector. Rig count is strongly responsive to oil price, but the metric only tracks usage, not productivity. Rig count hides the fact that every year, each rig drills more wells, and each well produces more hydrocarbon. These improvements are driven by technology, and the keys to our success are the application and development of these technologies.
The Key to Prosperity & Sustainability
Technology will make Canada more competitive, driving down our carbon footprint, increasing efficiency and productivity, and drastically improving our economics. If done right, technology can make Canada both prosperous and more sustainable.
So let’s dive into metrics that describe increased productivity from technology through a case study of BC drilling activity.
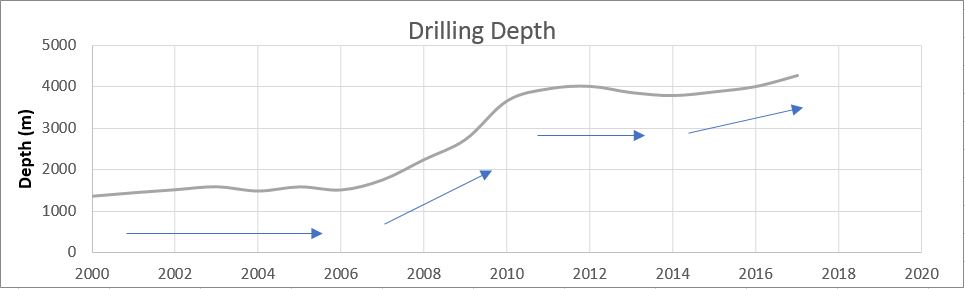
We can understand the effects of technology by looking at drilling metrics. The figures below show how we’ve explored drilling days and drilling depth since 2000 to identify 4 trends and understand drilling innovation in 4 periods of time.
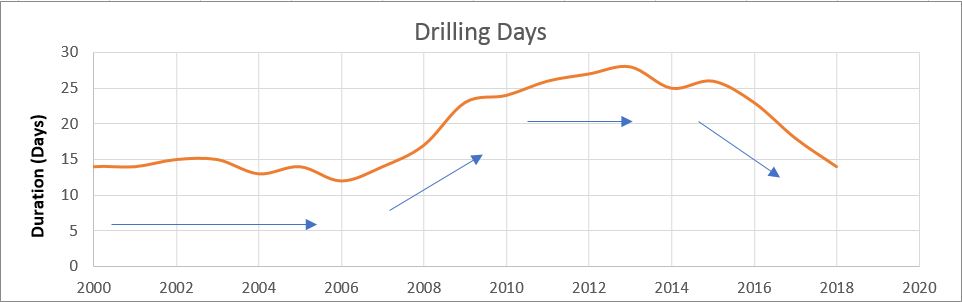
Four Periods
- In the first period, from 2000 to 2006, drilling days and depth stayed flat. Horizontal drilling and hydraulic fracturing already existed but had not yet become popular. The focus was around de-risking well exploration by understanding the geology.
- In the second period, from 2006 to 2010, drilling days and depth both increased. Horizontal drilling and hydraulic fracturing were becoming popular and commercially viable. The focus was to push the technical limits of horizontal wells, leading to a period of increasing well complexity. Understandably, drilling complex wells for the first time that were deeper and more directional, would take more time to drill.
- In the third period, from 2010 to 2014, drilling days and depth stayed flat again. The energy industry was hit hard by the financial crisis in 2007-08, so the industry focused on the stabilityof reliable cash flows, while developing technologies in directional drilling, multi-stage hydraulic fracturing, proppants, walking rigs and data analytics.
- We are now in the last period. Drilling days and depth have de-coupled, where drilling days are going down while we’re drilling deeper wells! This is a period of well manufacturing, where our strong understanding of the geology and new technologies help us de-risk the well economics.
Whether it is new seismic interpretation methods, or digital automatic drilling rigs, or remote wells controlled by sensors “on the edge”, we need to continually push the frontiers of technology to further improve our well economics.
You Can't Apply Data Science Without The Data
To develop and implement these technologies, we can draw best practices from lean manufacturing such as standardized work, visual controls and waste reduction. The fundamental part of lean manufacturing is to measure everything because you can’t apply data science without the data. And not just any data, because effective decision making requires standardized, reliable data to confidently draw patterns and conclusions.
And that’s what we’ve done in this BC case study. From the Unsist comprehensive database, we analyzed the data and drew insights into recent technological progress in Oil & Gas.
Thanks for reading! In our upcoming studies, we’ll dive even deeper into daily operations. There is much more value hidden in the granular details of Big Data. So stay tuned to improve your efficiencies and bottom line when we look into time code analysis, bit and drilling rig analysis, and well geometry and geology.