Data Science Spotlight - NEB & EIA
Posted on March 2 at 10:47am
In our last article, we looked into the short-term history of Canadian Oil & Gas to point out substantial change over the last few years. Now, with that as context, let’s look forward 20 years to understand where we’re headed.
Canadian oil production grew 18% from 2014 to 2018, all amid several headwinds - the collapse in oil price, blazing forest fires, slow growth in export capacity and an increasingly competitive global market. Current oil production of 4.5 Mbpd translates into roughly $65B in annual oil revenue for Canada (at $50 oil), and production is forecasted to grow another 40% by 2040 (see Analysis below). When a forecast suggests 40% growth, or an additional $26B in oil revenue, the credibility of the sources and their assumptions becomes extremely important. Forecasts are critical for decision-makers to establish with some degree of confidence where the market is going, to determine how much capital to spend, where to spend it, and when the investment will produce a return. In our Data Science Spotlight, we showcase 2 credible sources that both forecast 40% growth. The National Energy Board (NEB) and the Energy Information Administration (EIA) are government agencies for Canada and the United States respectively, responsible for providing energy information that supports public policy and the private sector as well.
Data Science Spotlight
What is the Data Science Spotlight? This is the first of a series of articles where Unsist explores data sources from a data science perspective. We evaluate the quality of the data, insightfulness of the analysis, and the usability of their websites.
Canada and US currently represent roughly 20% of global oil production, and growth in Shale and the Oil Sands have positive implications for how North American businesses can view the future and plan accordingly. We’ve chosen NEB and EIA to compare forecasts of the future because of the comprehensiveness and openness of their platforms. In the following article, we will evaluate both platforms in the follow 3 areas: data, analysis and usability.
#1 - Data
NEB and EIA provide very useful data about the energy markets across similar areas such as production and consumption, exports and imports, inventories and commodity prices. However, EIA provides more breadth and depth because its data covers nearly all energy producing countries while NEB primarily focuses on Canada. In addition, both deliver data on an annual or monthly basis, but EIA often provides weekly and daily data as well.
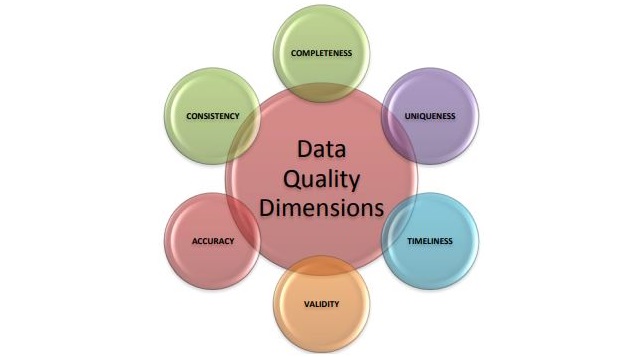
Since we’re handling so much data across so many different areas, it’s helpful to have a checklist to determine that we’re working with the highest quality of data possible. DAMA UK provides an excellent guide on data dimensions that can be used to decide on data quality.
Their data quality dimensions include:
- Completeness – a percentage of data that includes one or more values.
- Uniqueness – When measured against other data sets, there is only one entry of its kind.
- Timeliness – How much of an impact does date and time have on the data?
- Validity – Does the data conform to the respective standards set for it?
- Accuracy – How well does the data reflect the reality that is identified by it?
- Consistency – How well does the data align with a preconceived pattern?
While we can dive much further into each of these metrics, the purpose here is to highlight that NEB and EIA score very well against all metrics. We can be assured of the data availability and quality since both organizations are responsible for supporting policy (royalties, taxes, infrastructure investments) and informing financial markets (investors heavily rely on the weekly EIA inventory reports
.#2 - Analysis
The analysis category covers breadth and depth, while also including insightfulness and value. The NEB and EIA explore industry activity and trends and provide forecasts into 2040 or 2050. Both organizations look nationally and individually by province/state, however EIA goes a step further to provide a Country Analysis Brief for nearly 100 countries or regions of interest. We strongly recommend giving some of these a read - particularly for Canada!
We introduced this article with oil production forecasts up to 2040. Forecasts are data about the future, but are built on an understanding of data about the past and present. Since NEB and EIA have strong understandings of the past and present, their outlooks into the future become very interesting. Both organizations approach their forecasts with a reference case, and then evaluate several high/low scenarios for technology development, energy sustainability, economic growth and commodity prices. We also recommend these scenario studies, and focus on the reference case in this article.
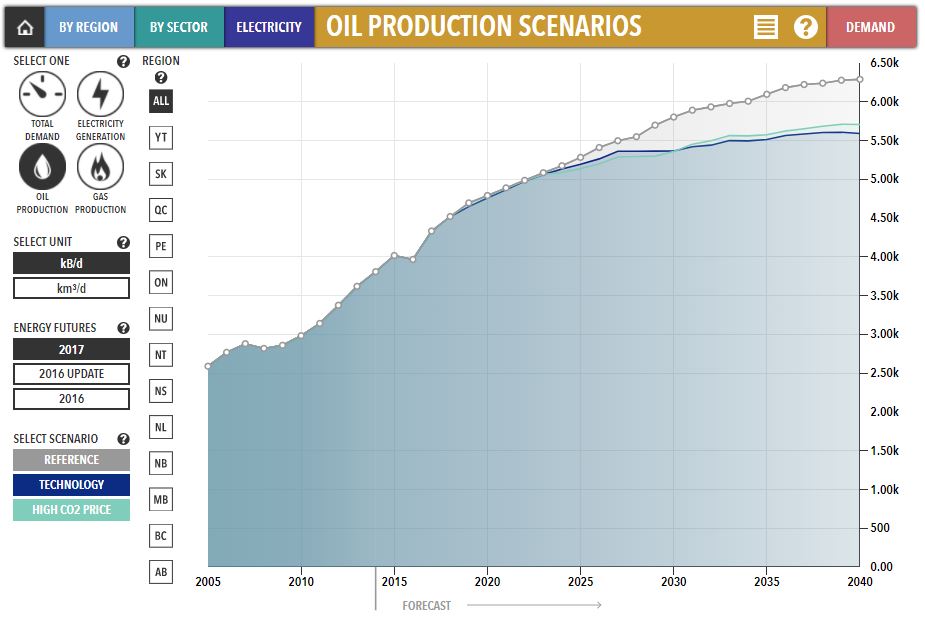
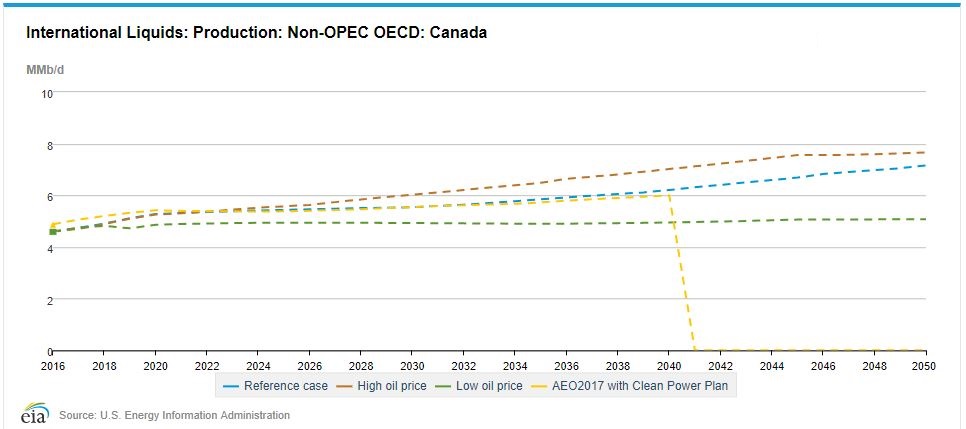
In the charts below, NEB reference case forecasts Canadian oil production of 6.3Mbpd by 2040 while EIA predicts 6.1Mbpd, both a substantial increase from 2018 levels of 4.5Mbpd.
NEB Oil Production Forecast
EIA Oil Production Forecast
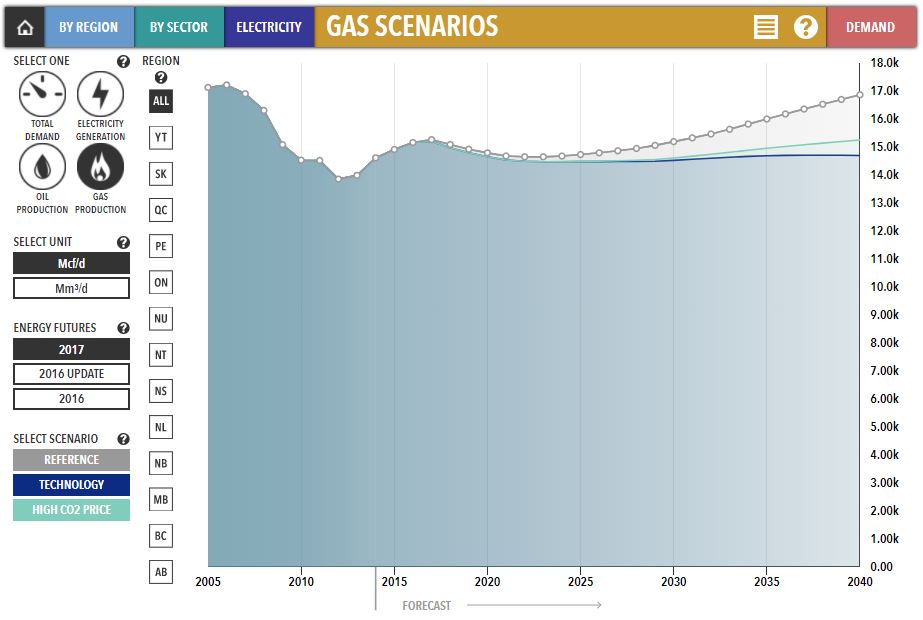
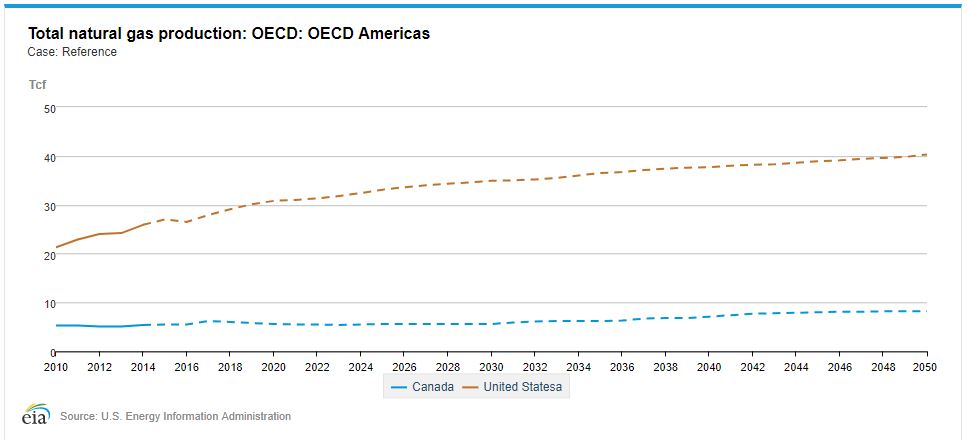
And let’s not forget gas production. NEB reference case forecasts Canadian gas production of 6.2 Tcf annually by 2040 while EIA predicts 7.1 Tcf annually, from 2018 levels of 5.5 Tcf annually.
NEB Gas Production Forecast
EIA Gas Production Forecast
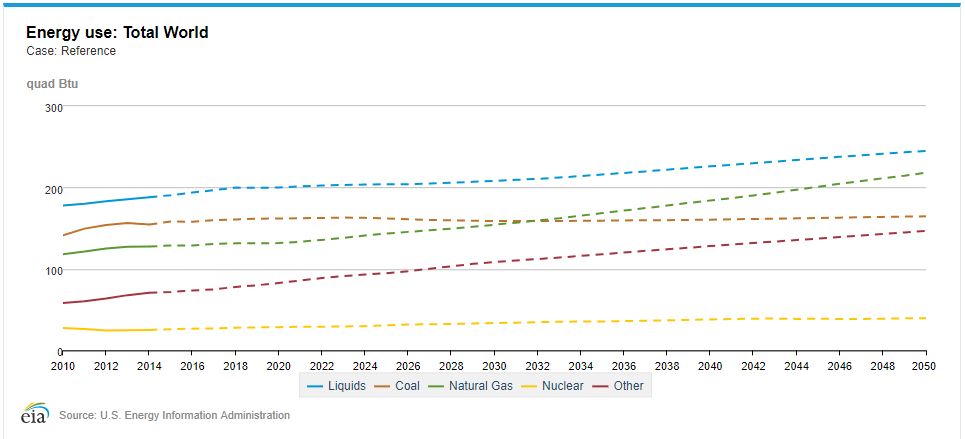
The takeaway here is that petroleum continues to play a significant role in the energy mix, globally accounting for 54% (82% including coal) and forecasted to 55% in 2040.
#3 - Usability
In the usability category, we evaluate the platforms based on functionality and user experience.
From a functionality perspective, we’re interested to know what users are able to do on the platform, such as downloading a variety of files, connecting directly to an online database or having a developer API for custom programming (API: application programming interface).
For user experience, we look at the intuitiveness for users to understand the value of the platform, to learn about the features, and to find the data or analysis they want. For example, many users find it valuable when the platform curates and prepares key resources to access conveniently. On the other hand, many users also seek the ability to sort, filter and interact with the data before download to access relevant data only. Platforms deliver the user experience by making it easy to gain value from Big Data, and the granular data too.
Comparing NEB and EIA in this last category, we see that EIA provides better functionality and user experience. While both platforms provide many datasets and reports to download, EIA Open Data provides data extensions for Microsoft Excel and Google Sheets, and even an API for data scientists like ourselves.
Innovation doesn’t happen when you collect data, it’s when you use it
In this Data Science Spotlight, we evaluated the data platforms for NEB and EIA, and identified EIA as the better platform across all 3 categories. However, both platforms provide substantial value in different ways, and we recommend using both. In fact, there are many other sources of energy data that we recommend including, especially when comparing long-term production forecasts into 2040.
Among others, we recommend the following sources too:
- IEA World Energy Outlook
- World Energy Council
- OPEC World Outlook
- CAPP Forecasts
- BP Energy Outlook
- Shell New Lens Scenarios
- Exxon Outlook for Energy
We’ve demonstrated how we evaluate data at Unsist. Our evaluation method is not limited to the data we have access to, but also to the data that we provide access to, through our own data platform. When you evaluate data platforms in the future, think about the data, the analysis and the usability - because innovation doesn’t happen when you collect data, it’s when you use it.
If you have an idea for our next Data Science Spotlight, feel free to contact us and let us know!